US PPI Jumps 6.3% in September, Bitcoin Dips Below $80,000 Before Rebounding
Author: Crypffalo Research · 23:55 15/10/2026
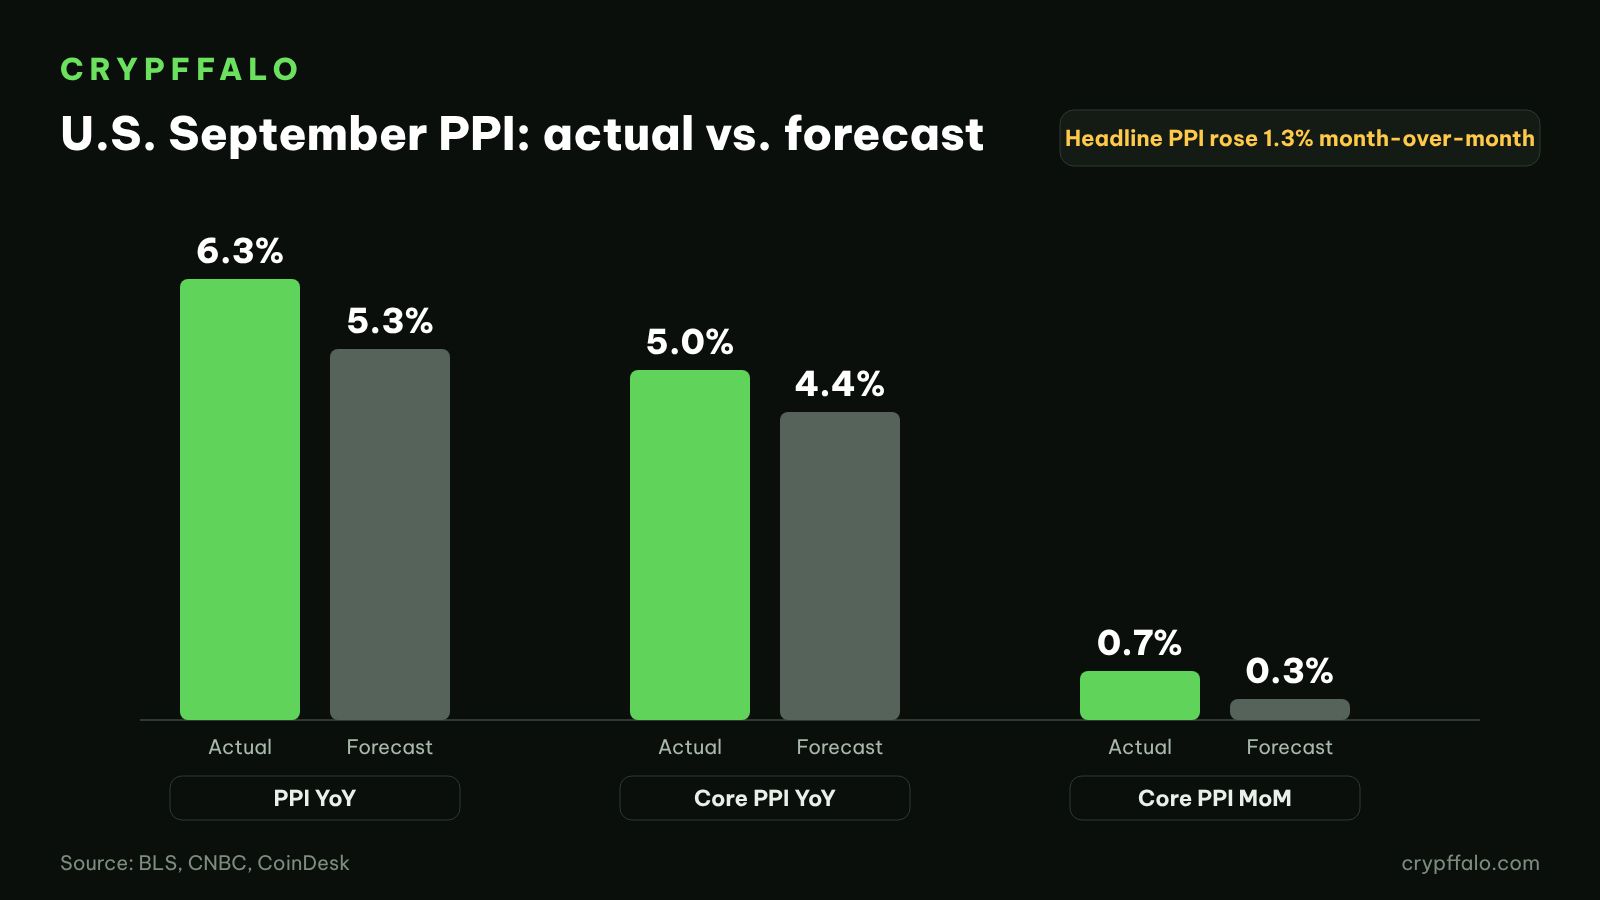
U.S. producer prices rose 6.3% year-over-year in September, well above the 5.3% forecast. Bitcoin fell below $80,000 for the first time since mid-September before rebounding near $82,100 as Treasury yields eased.

U.S. producer prices jumped 1.3% in September from August and 6.3% from a year earlier, far above economists' forecasts. It was the largest monthly gain since March 2022, according to Labor Department data released at 8:30 a.m. ET on Oct 15.
Just over an hour later, bitcoin slipped below $80,000 for the first time since mid-September. The drop did not last, with BTC climbing back above $81,000 by around 10:30 a.m. ET and trading near $82,100 by midday in New York.
Key takeaways
- Wholesale inflation: Headline PPI rose 6.3% year-over-year versus roughly 5.3% expected; core PPI rose 5% versus 4.4% expected.
- Main driver: Energy prices rose 10.8% in the month, with gasoline up about 20%.
- Bitcoin: BTC dipped under $80,000 around 9:47 a.m. ET, then recovered to roughly $82,100.
- Yields: The 10-year Treasury yield eased to about 5.04% after spiking to 5.36% on Oct 14.
- Fed: Odds of a rate hike at the Oct 28 meeting fell to about 27%, according to CoinDesk.
September PPI ran hot across the board
PPI tracks the prices businesses receive for their goods and services, so it is often seen as an early signal for consumer inflation. The September data shows price pressure spreading beyond a single category.
- Headline PPI: +1.3% month-over-month; +6.3% year-over-year, the highest since late 2022.
- Core PPI (ex food and energy): +0.7% month-over-month versus 0.3% expected; +5% year-over-year.
- Energy: +10.8% in the month; gasoline +20.3%, about half of the rise in goods prices.
- Services: +0.8%, the largest monthly increase since April.
The report landed one day after September CPI came in at 3.7%, also above forecasts. Elevated oil prices tied to Middle East tensions were a common driver behind both readings.
How bitcoin traded on Oct 15
Crypto markets were already under pressure early in the day as South Korea's Kospi fell another 7.5% or so. The PPI print added to selling pressure once U.S. trading began.
- Early Oct 15: BTC hovered around $80,400–$81,000; ether touched about $2,314, its lowest since Aug 20.
- 8:30 a.m. ET: PPI released, beating forecasts on both headline and core measures.
- Around 9:47 a.m. ET: BTC fell below $80,000 as the Nasdaq dropped about 1.4%.
- Around 10:30 a.m. ET: BTC reclaimed $81,000 as U.S. stocks pared losses.
- Midday ET: BTC near $82,100, ETH near $2,430.
Notably, Treasury yields fell after the PPI release. Investors appeared more worried that energy-driven inflation would squeeze spending and slow the economy than about an aggressive Fed response.
ETF outflows continue
U.S. spot bitcoin ETFs posted net outflows of $261.4 million on Oct 14, right after the CPI report, according to Farside. Fidelity's FBTC lost $152.7 million and BlackRock's IBIT shed $110.9 million.
A session earlier, on Oct 13, the same funds had attracted $175.7 million in net inflows. The quick reversal suggests institutional investors are reacting closely to each macro data point.
What it means for crypto markets
Bitcoin held the $80,000 area in this session and has bounced about $2,000 off the low. Even so, it remains roughly 36% below its $126,080 record set in October 2025, according to Bitcoin Magazine.
- Bull case: Yields keep falling and the Fed holds rates on Oct 28, helping BTC retest the $82,500–$83,700 resistance zone analysts are watching.
- Risk case: Oil keeps climbing, inflation spreads further into services, and the Fed signals a hike, putting $80,000 back in play.
Two consecutive inflation beats leave the Fed in a tough spot, balancing price stability against the risk of a slowdown. That suggests sharp swings around macro releases may persist.
What to watch next
- Spot bitcoin ETF flows for Oct 15.
- Fed officials' remarks before the blackout period ahead of the Oct 28 meeting.
- Brent crude and developments in the Middle East.
- The Kospi and Asian chip and tech stocks.
- Check the economic calendar and real-time liquidations.
Frequently Asked Questions
How is PPI different from CPI?
PPI measures prices at the producer and wholesale level, while CPI tracks what consumers pay. A sharp rise in PPI often signals pressure on CPI in the following months.
Why did bitcoin bounce despite the hot PPI?
Treasury yields fell and the odds of an October Fed hike dropped to about 27%, easing sentiment. U.S. stocks paring losses also helped crypto.
Why does $80,000 matter?
It is a psychological level bitcoin had not broken since mid-September. The quick recovery suggests buyers are still active at lower prices.
*This content is for information only and is not financial advice.*
Tags: Bitcoin, PPI, Inflation, Fed, Macro
Related articles
- Mt. Gox Delays Bitcoin Repayment Deadline to Oct 2027, 34,400 BTC Still in Wallets
- France Votes 31.4% Tax on Crypto-to-Stablecoin Swaps by a Single Vote
- Bitcoin ETFs pull in $526.7M as BlackRock files for downside-protected BTC ETF
- Strive buys 4,045 BTC for $335 million, lifts Bitcoin holdings to 36,818 BTC
- Strategy buys 267 BTC, spends $193M on STRC buyback, lifts limit to $3B
- China Q3 GDP beats forecasts at 4.5%, Bitcoin rebounds to $82,500