Fibonacci Retracement: How to Find Entry Zones on Pullbacks, Set Stop Loss and Targets
Author: Crypffalo Research · 13:50 11/10/2026
How to draw Fibonacci retracement correctly, what the 0.382 · 0.5 · 0.618 · 0.786 levels mean, the 0.5–0.618 golden zone, using confluence to set entry, stop loss and extension targets, and when Fibonacci fails.

Price has just rallied hard and is now pulling back. The question every trader faces is: how deep is a pullback still worth buying, and where has the trend broken? Fibonacci retracement is a simple tool that answers this with concrete price zones instead of guesswork. This guide covers how to draw it correctly, the 0.5–0.618 "golden zone", how to combine it with other levels to set entry, stop loss and targets, and when Fibonacci fails.
Quick summary
- Fibonacci retracement measures how much of the previous move a pullback has given back. The common levels: 0.382 · 0.5 · 0.618 · 0.786.
- In an uptrend, drag the tool from swing low A to swing high B. Healthy pullbacks often stop between 0.382 and 0.618.
- Fibonacci is strongest when it lines up with other levels: old support, the EMA50, high-volume areas. A Fibonacci level on its own is just a line.
- Always have an invalidation point: a close below 0.786 or a break of low A means the pullback idea has failed.
- Common targets: the old high B and the 1.272 / 1.618 Fibonacci extensions.
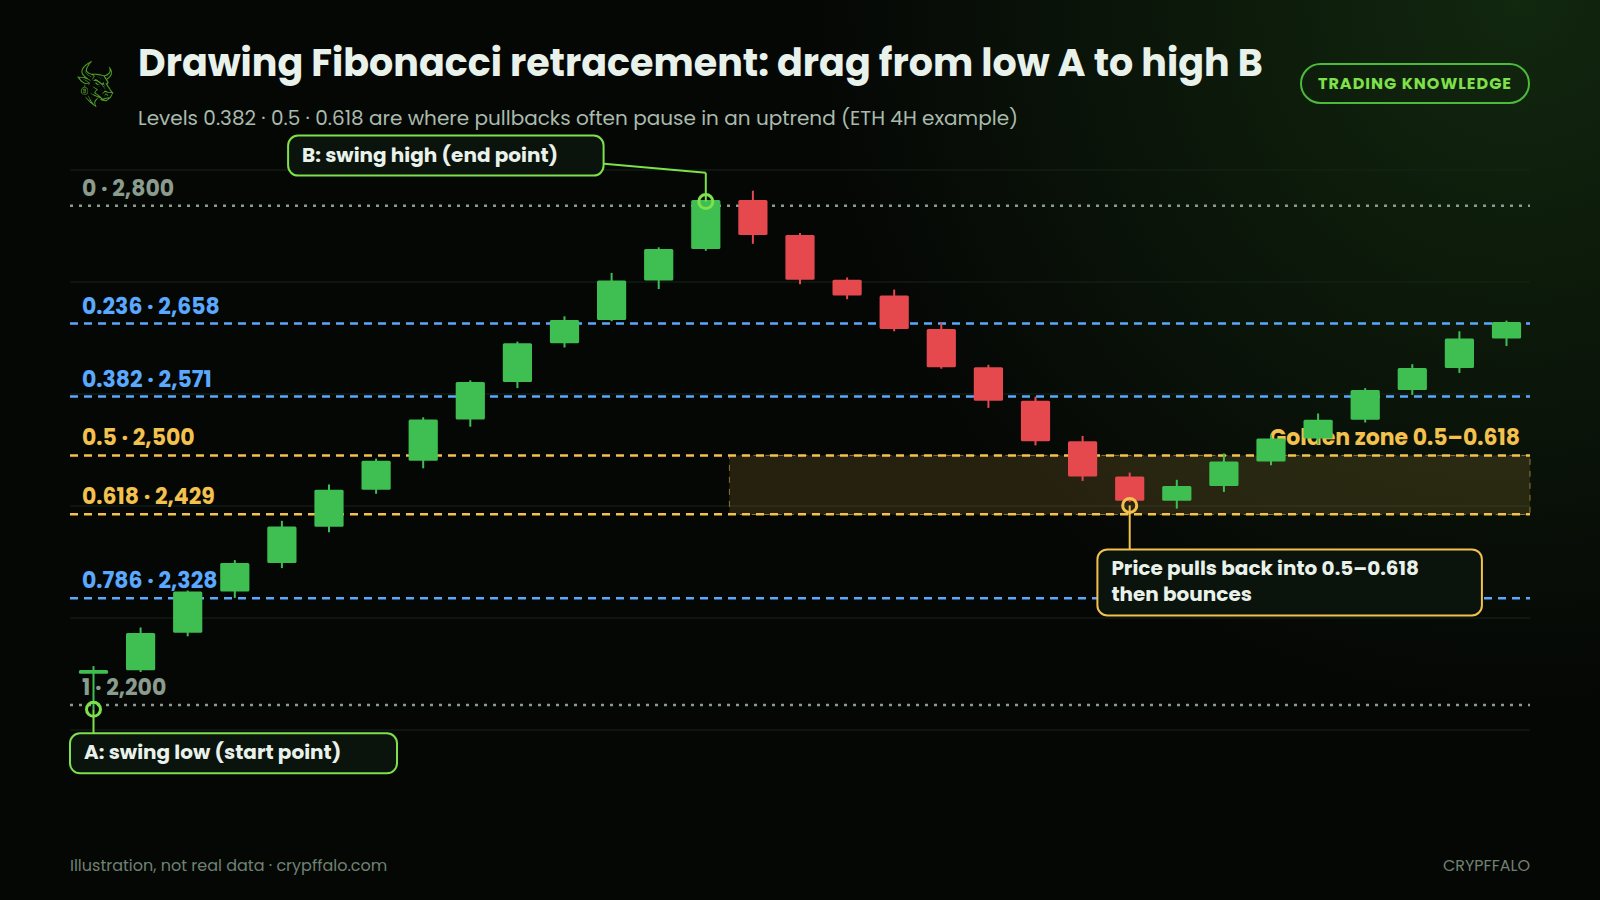
1. What is Fibonacci retracement?
The levels come from the Fibonacci sequence (0, 1, 1, 2, 3, 5, 8, 13…), where the ratio between neighboring numbers converges to 0.618. On a chart, the tool splits the distance from the low to the high of a move into percentage levels. There is nothing mystical about it: Fibonacci works largely because so many traders watch the same levels, so buy orders, take-profits and stop losses cluster around them.
What each level means in an uptrend pullback:
- 0.236: a very shallow pullback, common in very strong trends.
- 0.382: a shallow pullback, the trend is still healthy.
- 0.5: half of the move retraced. Not a Fibonacci ratio, but widely used.
- 0.618: the most watched level. The 0.5–0.618 area is often called the "golden zone".
- 0.786: a deep pullback and the last line of defense. A close below it clearly weakens the case for trend continuation.
2. How to draw Fibonacci correctly (common beginner mistakes)
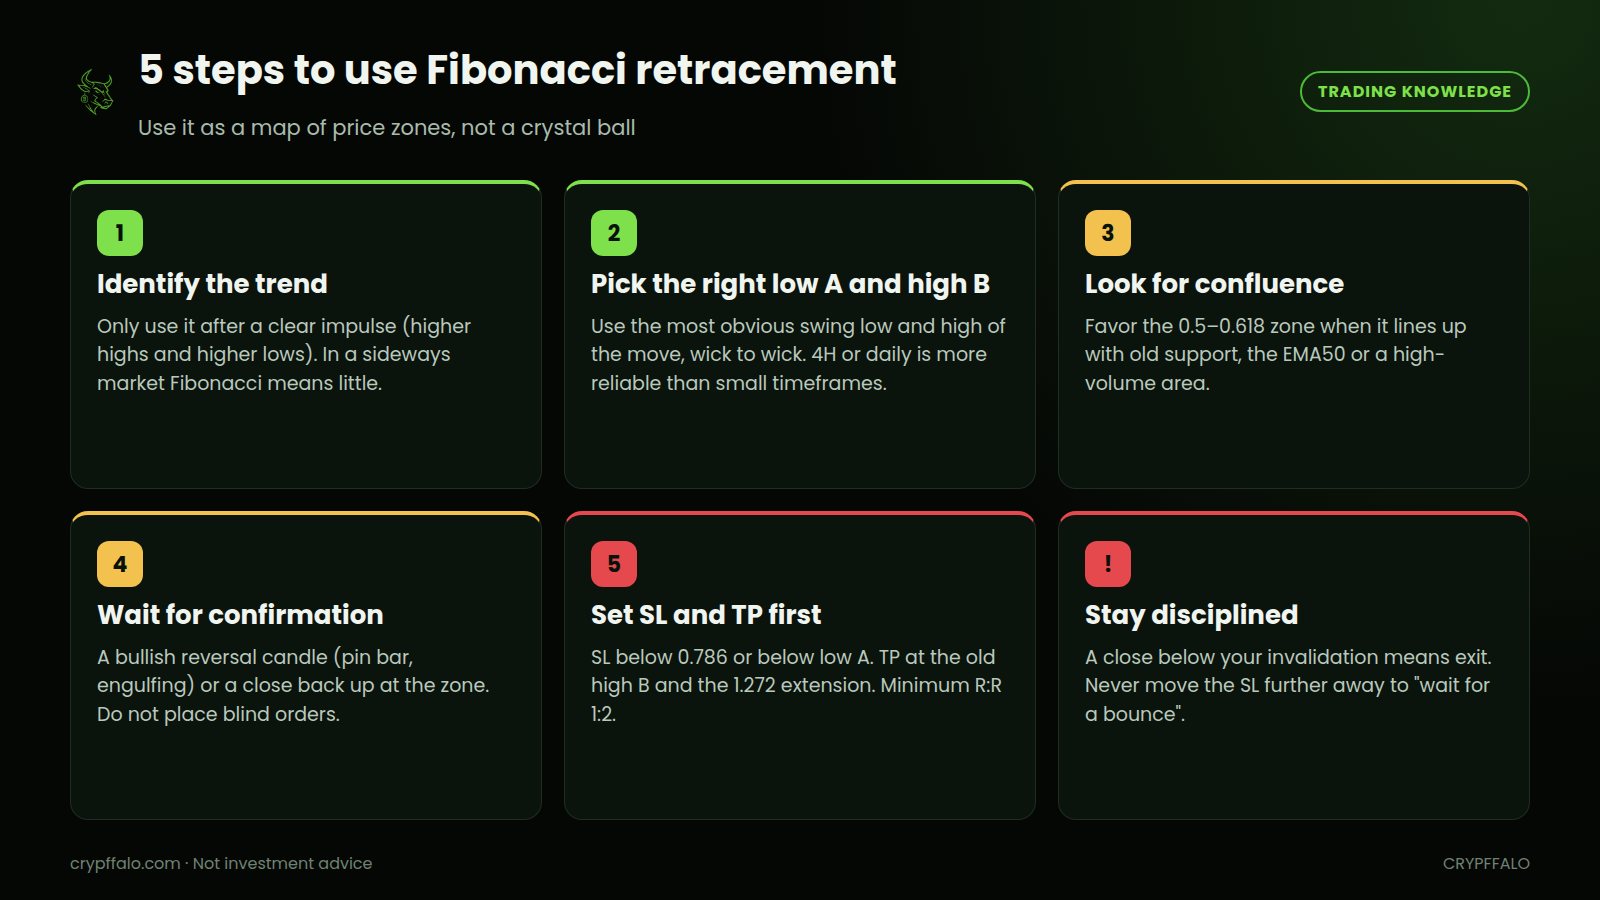
- Only draw it after a clear impulse: higher highs and higher lows. In a sideways market any high or low looks "valid" and Fibonacci means almost nothing.
- Pick the right low A and high B: use the most obvious swing low and high of the move, from the lowest wick to the highest wick. On TradingView, choose Fib Retracement, click low A and drag up to high B.
- Prefer higher timeframes: Fibonacci on the 4-hour or daily chart is far more reliable than on 5–15 minute charts, because the moves are bigger and more traders watch them.
- Do not keep redrawing it until it fits: if you move A and B every time price runs through a level, you are bending the tool to your bias.
- For downtrends, do the opposite: drag from the high to the low to find bounce zones that may get sold.
3. Fibonacci works best when it lines up with other levels
A single Fibonacci level is not enough reason to enter. What experienced traders look for is confluence: several independent reasons pointing to the same price zone.
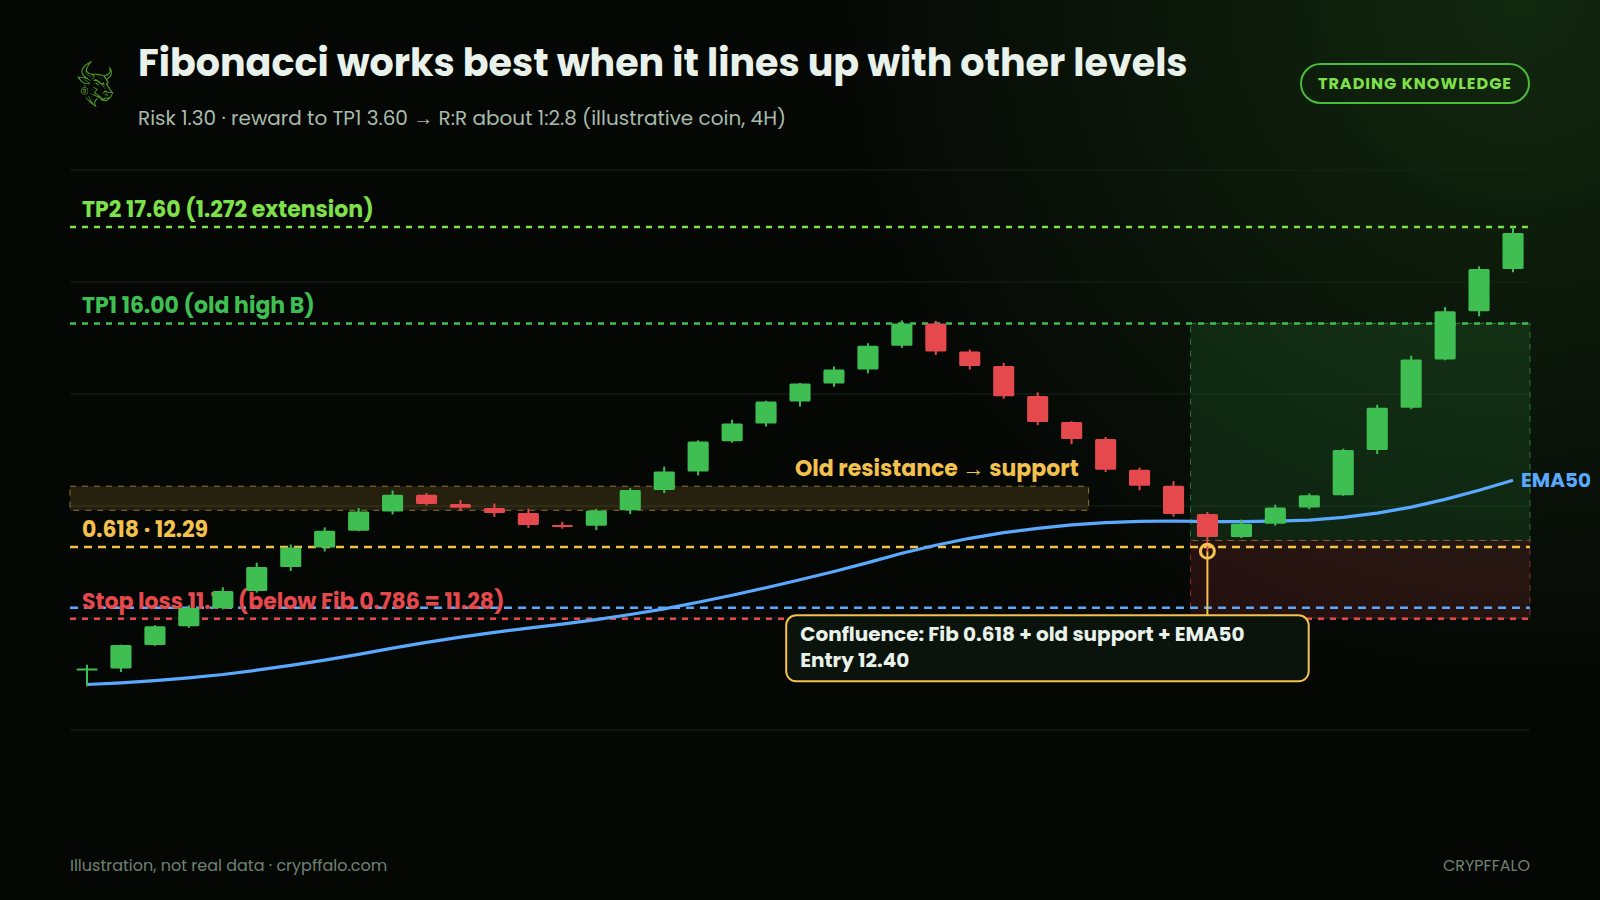
Levels that often line up with the 0.5–0.618 zone:
- Old resistance that was broken and is now support. This is the most reliable confluence. See Support and resistance in crypto.
- The EMA50 or EMA200 on the same timeframe. See EMA 20/50/200.
- Areas with heavy past volume, or old breakout zones. See Volume and breakouts.
- Round psychological numbers like $80,000 for BTC or $2,500 for ETH.
In the example above, the 12.3–12.4 area is the 0.618 level, old resistance turned support and the EMA50 all at once. Three reasons in one place are much more reliable than a lone Fibonacci line.
4. Setting entry, stop loss and targets with Fibonacci
- Entry: do not place a blind buy order exactly at 0.618. Wait for confirmation in the zone: a hammer, a bullish engulfing candle, or a candle closing back up. How to read these signals is covered in Reversal candlestick patterns.
- Stop loss: below the 0.786 level, or below low A if you want to give the trade more room. Do not put it right under 0.618, since price often sweeps slightly through it before bouncing.
- Target 1: the old high B, where profit-taking usually shows up.
- Target 2: the 1.272 or 1.618 extension of the A–B move. On TradingView you can enable these in the Fib Retracement settings.
- Check R:R before entering: the reward to target 1 should be at least twice the risk to your stop. In the example: risk 1.30, reward to TP1 3.60, R:R about 1:2.8.
- Position size should come from your stop distance, not from gut feeling. Use the position size calculator and the rules in Risk management for beginners.
5. When does Fibonacci fail?
No tool works every time. What matters is knowing in advance at what price you are wrong, and exiting with discipline.
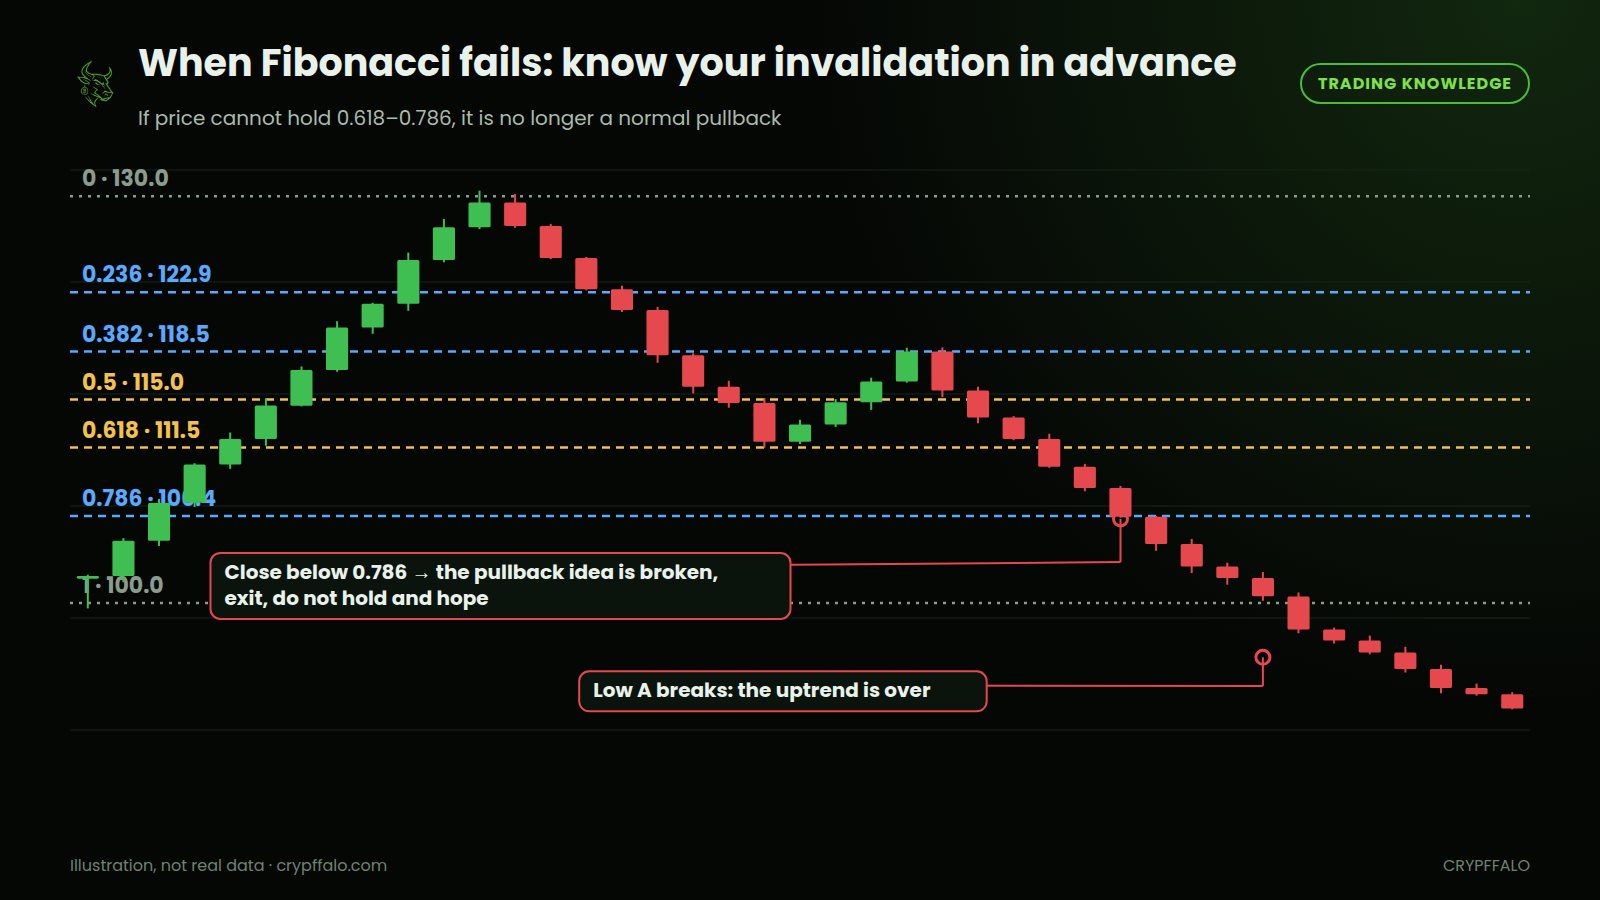
- A close below 0.786: the pullback has gone too deep; this is no longer a normal correction.
- A break of low A: the uptrend is over and this move's Fibonacci levels no longer apply.
- Major macro news: on CPI or Fed days, price can cut through any technical level. Check the Event calendar before placing trades.
- Liquidation cascades: when many leveraged longs get liquidated at once, price falls through support very quickly. Watch it on the Real-time Liquidations page.
FAQ
Should I use 0.5 or 0.618?
Look at the whole 0.5–0.618 zone rather than a single line. Price usually reacts somewhere inside the zone, and the level that lines up with old support or an EMA is the more reliable one.
Does Fibonacci work for every coin?
It works best on liquid coins like BTC, ETH and SOL. On small caps with thin trading, a few large orders can push price straight through the levels.
Which timeframe should I use?
Swing traders should draw on the 4-hour or daily chart. Lower timeframes are for fine-tuning the entry once price reaches the higher-timeframe Fibonacci zone.
Conclusion
Fibonacci retracement cannot predict exactly where price will stop, but it gives you a map of the zones worth watching and a clear invalidation point. Combine the 0.5–0.618 zone with old support, EMAs and a confirming candle, always set your stop loss before entering, and you will have a trade plan with a real basis instead of buying on feel.
*For information and education only, not investment advice. Illustrations use sample numbers.*
Tags: Trading Knowledge, Technical Analysis, Fibonacci, Support and resistance, Risk management
Related articles
- What is Bitcoin dominance? How to read BTC.D to spot altcoin season (with examples)
- What Are Bollinger Bands? How to Read the Squeeze, %B and BandWidth (With Examples)
- What Is DCA? How to Dollar-Cost Average Into Bitcoin (With Examples)
- What Is MACD? How to Read Crossovers, Histogram and Divergence (With Examples)
- Reversal Candlestick Patterns: Pin Bar, Engulfing, Doji and How to Read Them in the Right Place
- Market Cap, FDV and Circulating Supply: Check Before Buying Crypto