EMA 20/50/200: Using 3 Moving Averages to Read Crypto Trends
Author: Crypffalo Research · 17:05 06/10/2026
EMA20 tracks short-term moves, EMA50 swings, EMA200 the long-term trend. Learn Golden and Death Crosses, a 3-step trend process and invalidation levels.

What is an EMA?
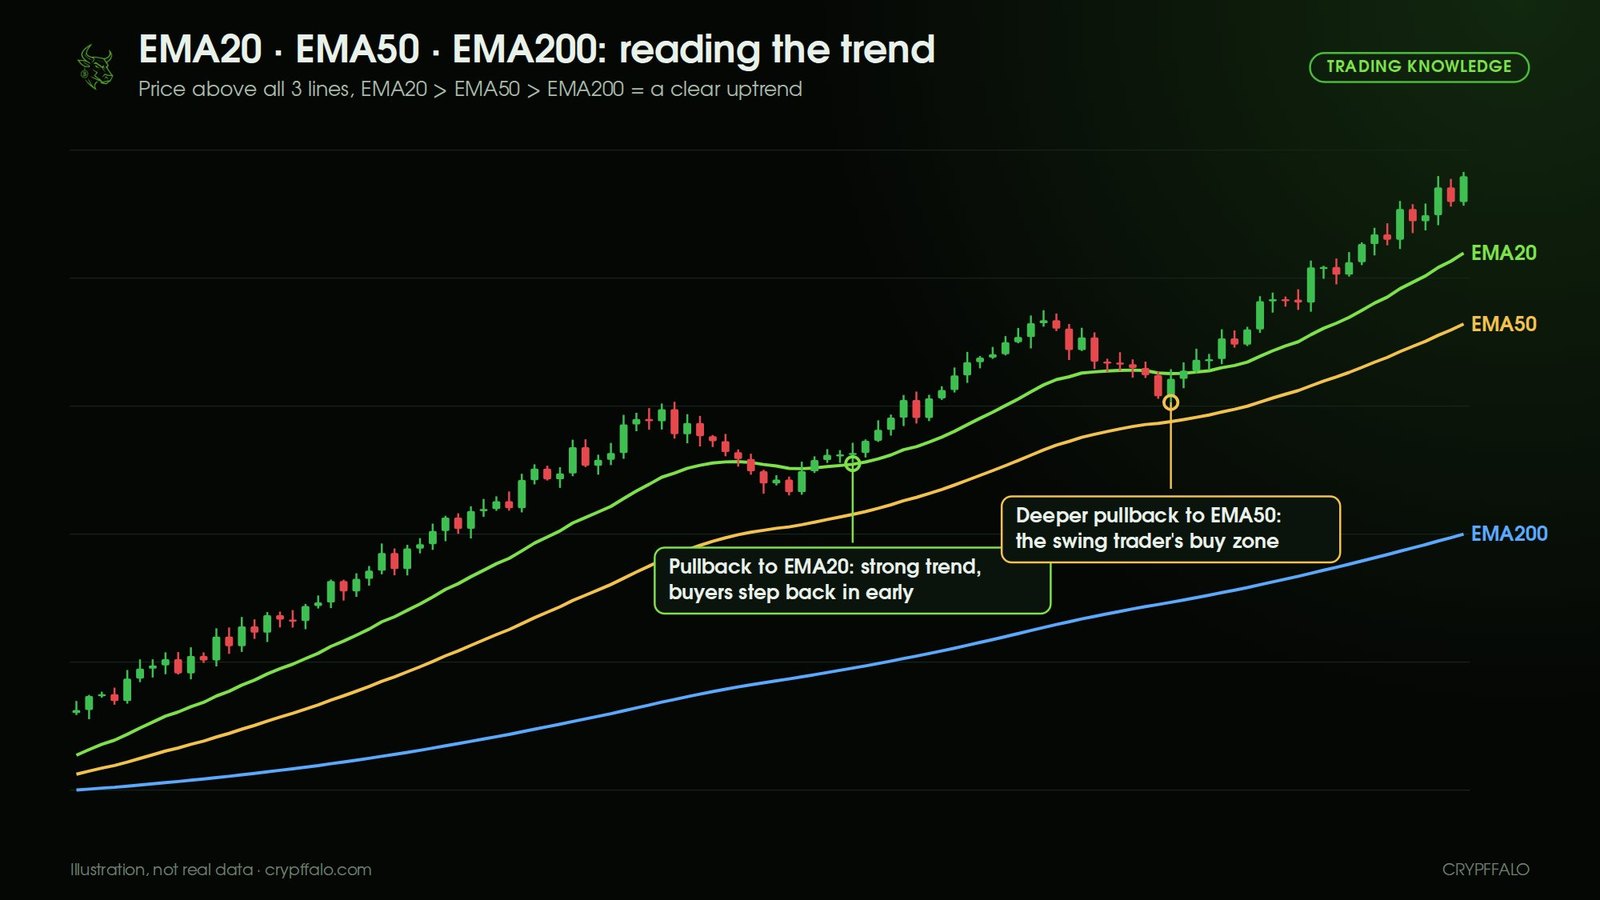
An EMA (Exponential Moving Average) is the average price over a recent number of candles, in which newer prices carry more weight than older ones. As a result, the EMA reacts faster than a simple moving average (SMA). The trio of EMA20, EMA50 and EMA200 is a simple way to read crypto trends on three levels: short term, medium term and long term. The core rule: price above all three lines with EMA20 > EMA50 > EMA200 is a clear uptrend; the reverse order is a downtrend.
Quick Summary
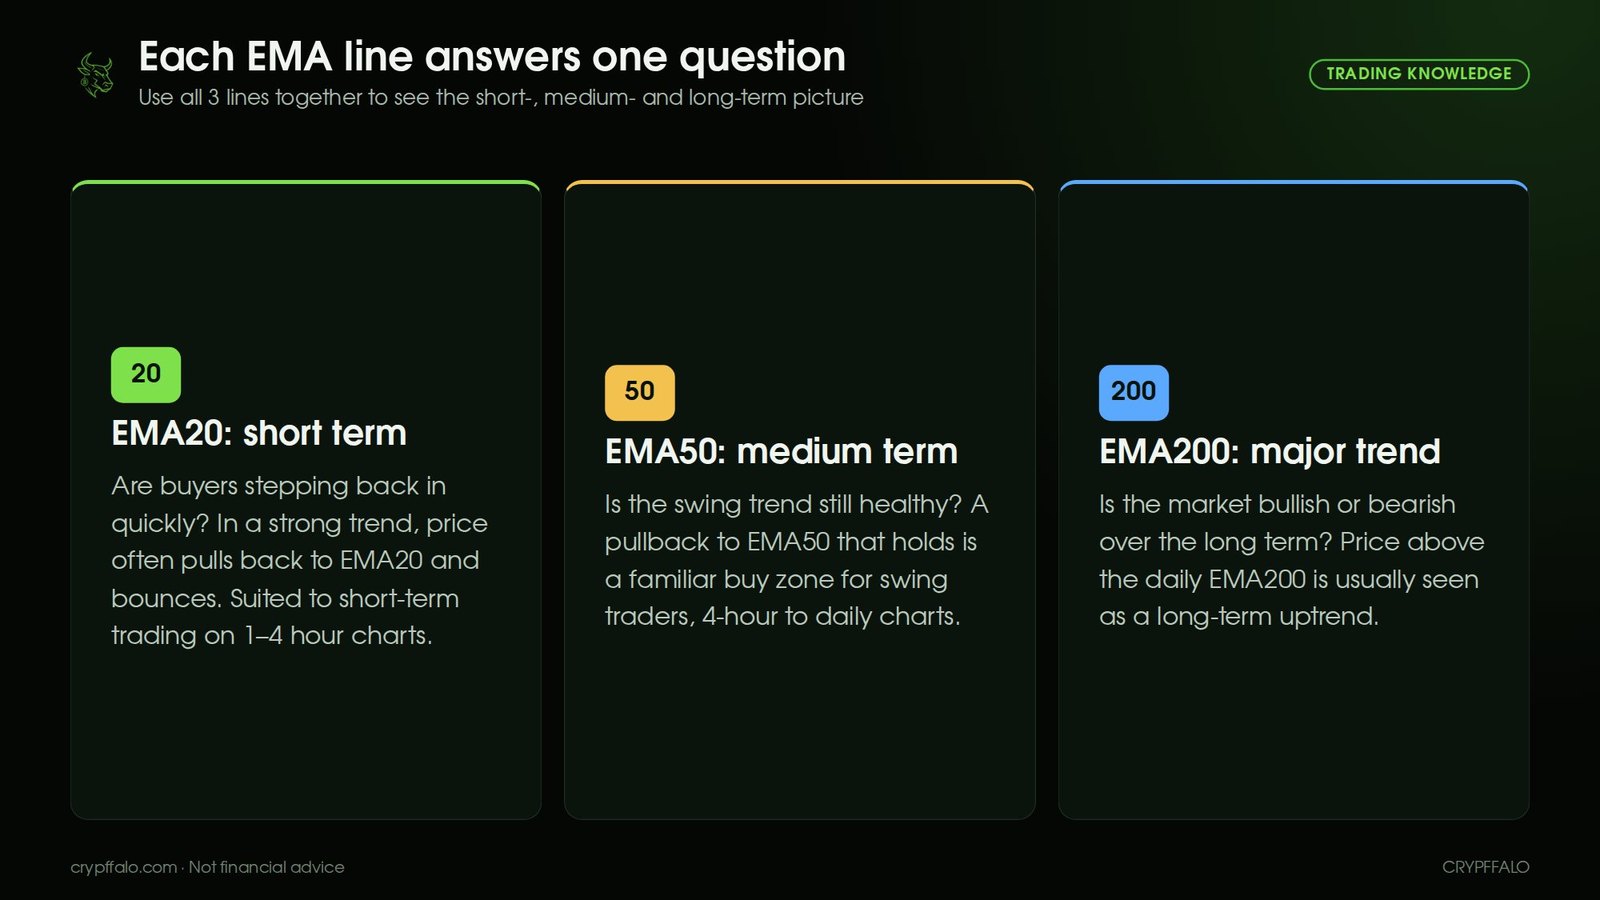
- EMA20: short-term moves. In a strong trend, price often pulls back to EMA20 and bounces.
- EMA50: medium-term (swing) waves. A pullback to EMA50 that holds is a familiar buy zone in an uptrend.
- EMA200: the major trend. Price above the daily EMA200 is usually seen as a long-term bull market.
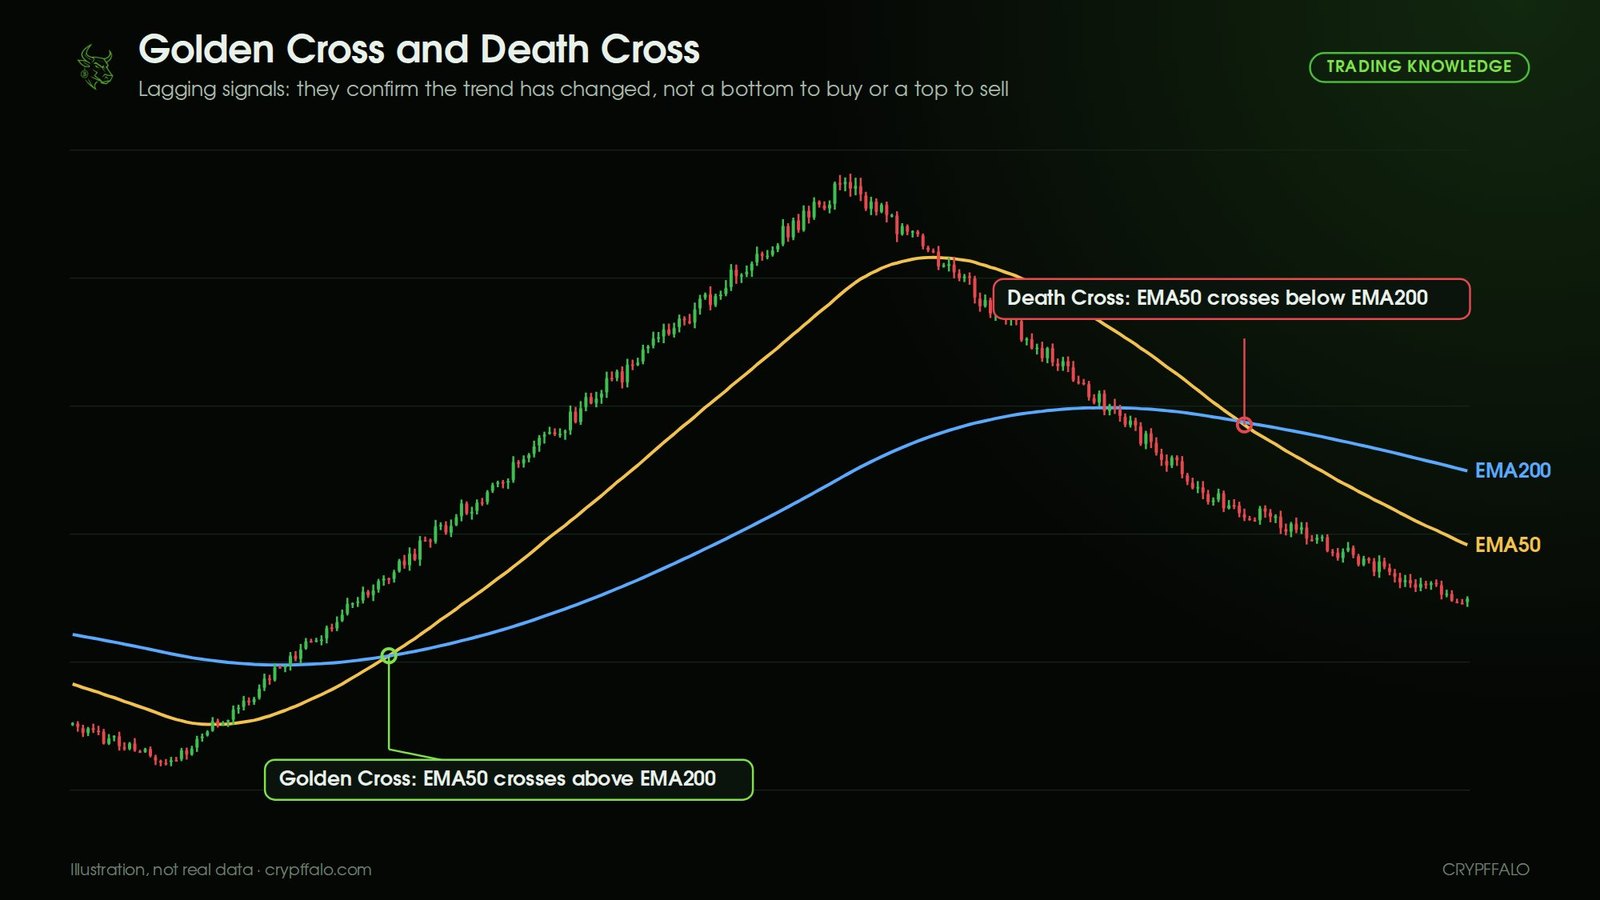
- Golden Cross (EMA50 crossing above EMA200) and Death Cross (EMA50 crossing below EMA200) are lagging signals, used to confirm that the trend has changed, not to catch bottoms or sell tops.
- Always tie every trade to an invalidation point, such as a candle close below the latest swing low or below a key EMA.
1. EMA20: Tracking Short-Term Moves
EMA20 hugs price the most closely of the three. It shows whether buyers are quickly "stepping back in" after each pullback.
- In a strong uptrend, price often only pulls back to touch EMA20 before continuing higher. This is a sign of very proactive buying pressure.
- When price closes below EMA20 for several candles in a row, the short-term rally is weakening and may turn into a deeper pullback toward EMA50.
- Suited to short-term trading on the 1-hour to 4-hour timeframes. On lower timeframes, price crosses EMA20 back and forth constantly when the market moves sideways, producing noisy signals.
2. EMA50: The Swing Trader's Line
EMA50 reflects the trend over a few weeks (daily chart) or a few days (4-hour chart).
- In a healthy uptrend, deeper pullbacks often stop around EMA50. Many swing traders wait for this zone to buy instead of chasing price.
- If price closes a daily candle below EMA50 and EMA20 starts crossing below EMA50, the medium-term trend is weakening.
- EMA50 also often acts as dynamic resistance in a downtrend: price bounces up to EMA50 and gets sold off.
3. EMA200: The Line That Defines the Long-Term Trend
The daily EMA200 is the most-watched line in the market, including in traditional stock markets.
- Price above the daily EMA200: the market is considered to be in a long-term uptrend; prioritize looking for buys on pullbacks.
- Price below the daily EMA200: prioritize defense; bounces up to EMA200 often meet selling pressure.
- The first retest of EMA200 after a long time often triggers a strong reaction, because so many people watch this line.
- For newly listed altcoins with fewer than 200 daily candles, the daily EMA200 is not yet meaningful; you can use the 4-hour EMA200 instead.
4. Golden Cross and Death Cross
- Golden Cross: EMA50 crosses above EMA200. This signals that the medium-term trend has become stronger than the long-term trend, and it usually appears after price has already risen significantly from the bottom.
- Death Cross: EMA50 crosses below EMA200. It usually appears after price has already fallen quite deeply from the top.
How to use them properly:
- Treat them as lagging confirmation signals. By the time the cross happens, price has usually already moved, so buying right at the cross is rarely the best price.
- In a sideways market, EMA50 and EMA200 can cross back and forth many times, creating false signals. Also check the price structure (higher highs and higher lows).
- Combine with volume: a Golden Cross with steadily rising volume is more reliable. See also Volume and Breakouts: Telling a Real Resistance Break from a Bull Trap.
5. How to Identify the Trend with EMA 20/50/200
A simple 3-step process, best done on the daily chart first before moving down to lower timeframes:
- Step 1, pick a side: is price above or below EMA200? Above favors Long; below favors staying out or a planned Short.
- Step 2, check the order: EMA20 > EMA50 > EMA200 with all three pointing up is a strong uptrend. Lines twisting together and moving sideways mean the market is consolidating, so reduce position size or stay out.
- Step 3, choose an entry zone: in an uptrend, wait for price to pull back to EMA20 (very strong trend) or EMA50 (normal trend), together with a bullish rejection candle (long lower wick, bullish engulfing candle).
6. Invalidation: When Is Your Plan Wrong?
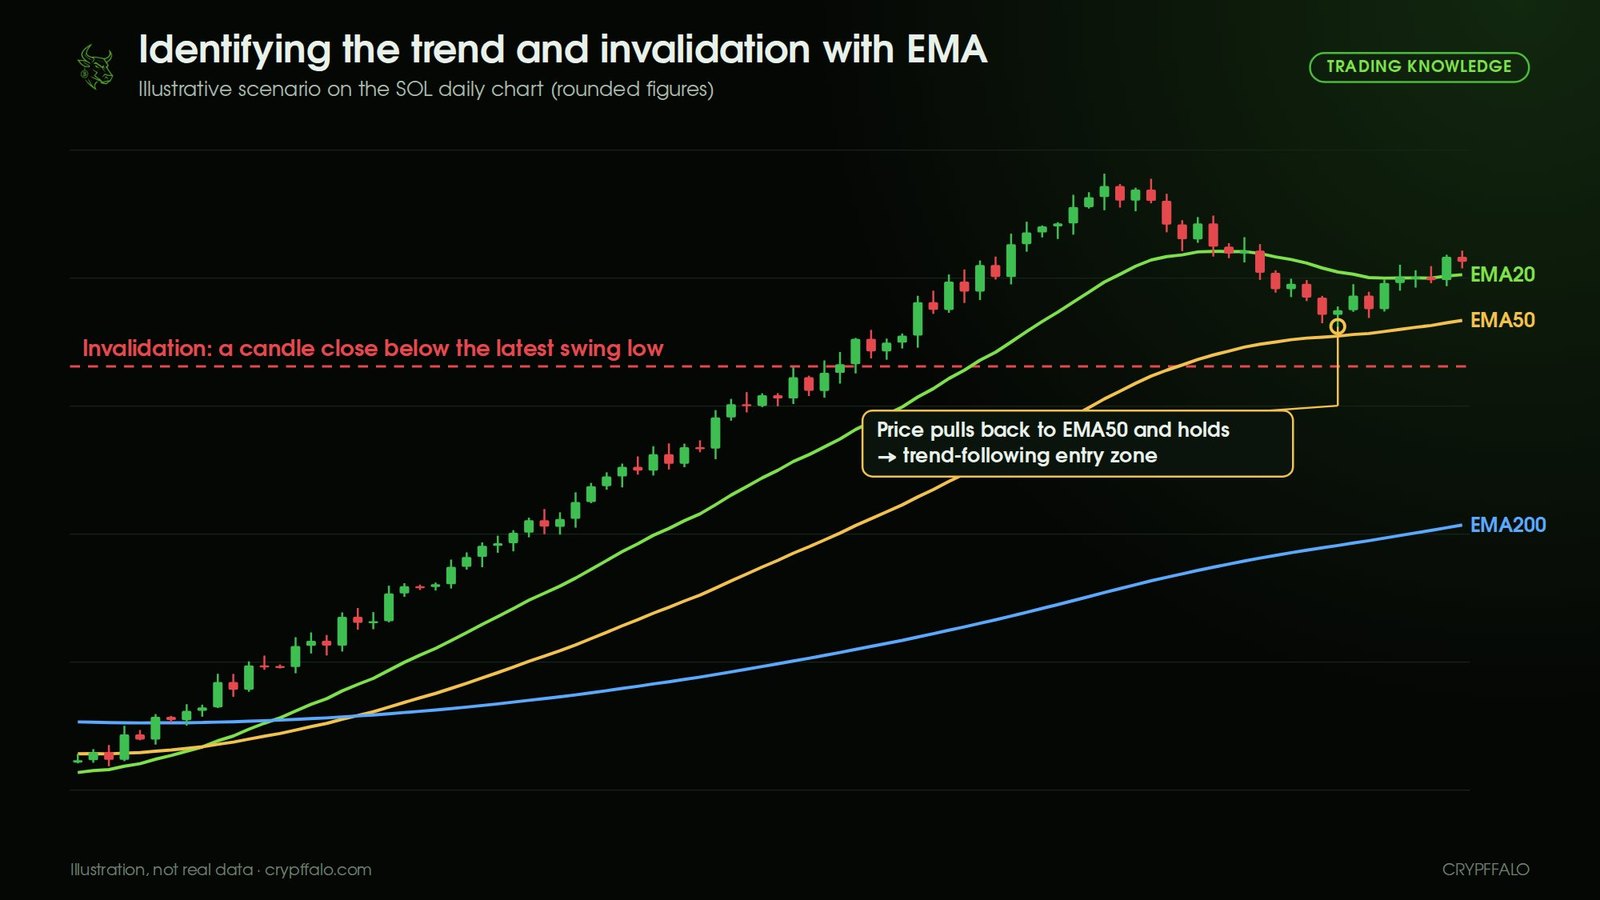
Invalidation is the price level where, if a candle closes beyond it, your reason for entering the trade no longer holds. Setting the invalidation point before entering a trade keeps you from emotionally "holding a losing position".
- Buy at EMA20: invalidation is usually a candle close below EMA50 or below the latest pullback low.
- Buy at EMA50: invalidation is usually a candle close below the latest swing low, or more loosely, below EMA200.
- Long-term trend: a daily close below EMA200 that is not reclaimed within a few candles signals that the long-term uptrend has broken.
- Illustrative example (rounded figures): SOL is rising on the daily chart, price pulls back to EMA50 around 156 USD and a hammer candle appears. A trader could buy around this zone, set invalidation at a daily close below the pullback low of about 152 USD, and take partial profits at the previous high. The distance from the entry price to the invalidation point determines position size; see how to calculate it in Risk Management for Beginners.
7. Common Mistakes When Using EMAs
- Using EMAs in a sideways market: the lines get crossed constantly and signals are noisy.
- Buying just because price touched an EMA without waiting for a reaction (rejection candle, volume).
- Treating a Golden Cross as a "guaranteed buy signal".
- Constantly tweaking settings (EMA 21, 34, 55…) to find the "perfect" set. The 20/50/200 set is popular precisely because so many people watch it.
- Ignoring the higher-timeframe context: the 1-hour chart is rising but the daily chart is still below EMA200.
Frequently Asked Questions
What is the difference between EMA and SMA?
The SMA averages all candles equally, while the EMA gives more weight to the most recent prices. That makes the EMA react faster to new moves, which suits the highly volatile crypto market, but it also produces noisy signals more easily.
Which timeframe should you use EMAs on?
Identify the trend on the daily chart (especially with EMA200), then use the 4-hour or 1-hour chart to find entries. The lower the timeframe, the noisier the signals.
Is a Golden Cross a buy signal?
A Golden Cross confirms that the medium-term trend has strengthened; it is not a signal to buy at the bottom. By the time the cross happens, price has usually already risen, so many traders wait for a pullback to EMA50 after the Golden Cross to enter.
Should you buy when price is below EMA200?
Price below the daily EMA200 shows the long-term trend is weak. Buying then means trading against the trend, with higher risk; if you do buy, reduce your position size and set a clear stop loss.
What does the daily EMA200 mean for Bitcoin?
It is the line many investors use to distinguish a long-term bull market from a bear market. BTC holding above the daily EMA200 usually comes with positive sentiment, while losing it often leads to a longer correction.
Note
This article is for educational purposes; the charts are illustrations, not real data. This is not financial advice. EMAs are a reference tool; always combine them with risk management and stop losses.
Tags: Trading Knowledge, Technical Analysis, EMA, Moving Averages, Golden Cross
Related articles
- What is Bitcoin dominance? How to read BTC.D to spot altcoin season (with examples)
- What Are Bollinger Bands? How to Read the Squeeze, %B and BandWidth (With Examples)
- What Is DCA? How to Dollar-Cost Average Into Bitcoin (With Examples)
- What Is MACD? How to Read Crossovers, Histogram and Divergence (With Examples)
- Reversal Candlestick Patterns: Pin Bar, Engulfing, Doji and How to Read Them in the Right Place
- Fibonacci Retracement: How to Find Entry Zones on Pullbacks, Set Stop Loss and Targets